Debugging
BitMasher comes with debugging and instrumentation tools found in BM_DebugServices and can be used to profile performance or to indicate points of interest.
Debug Ports
Four GPIO pins are broken out into test points on the PCB and each test point is assigned a label:
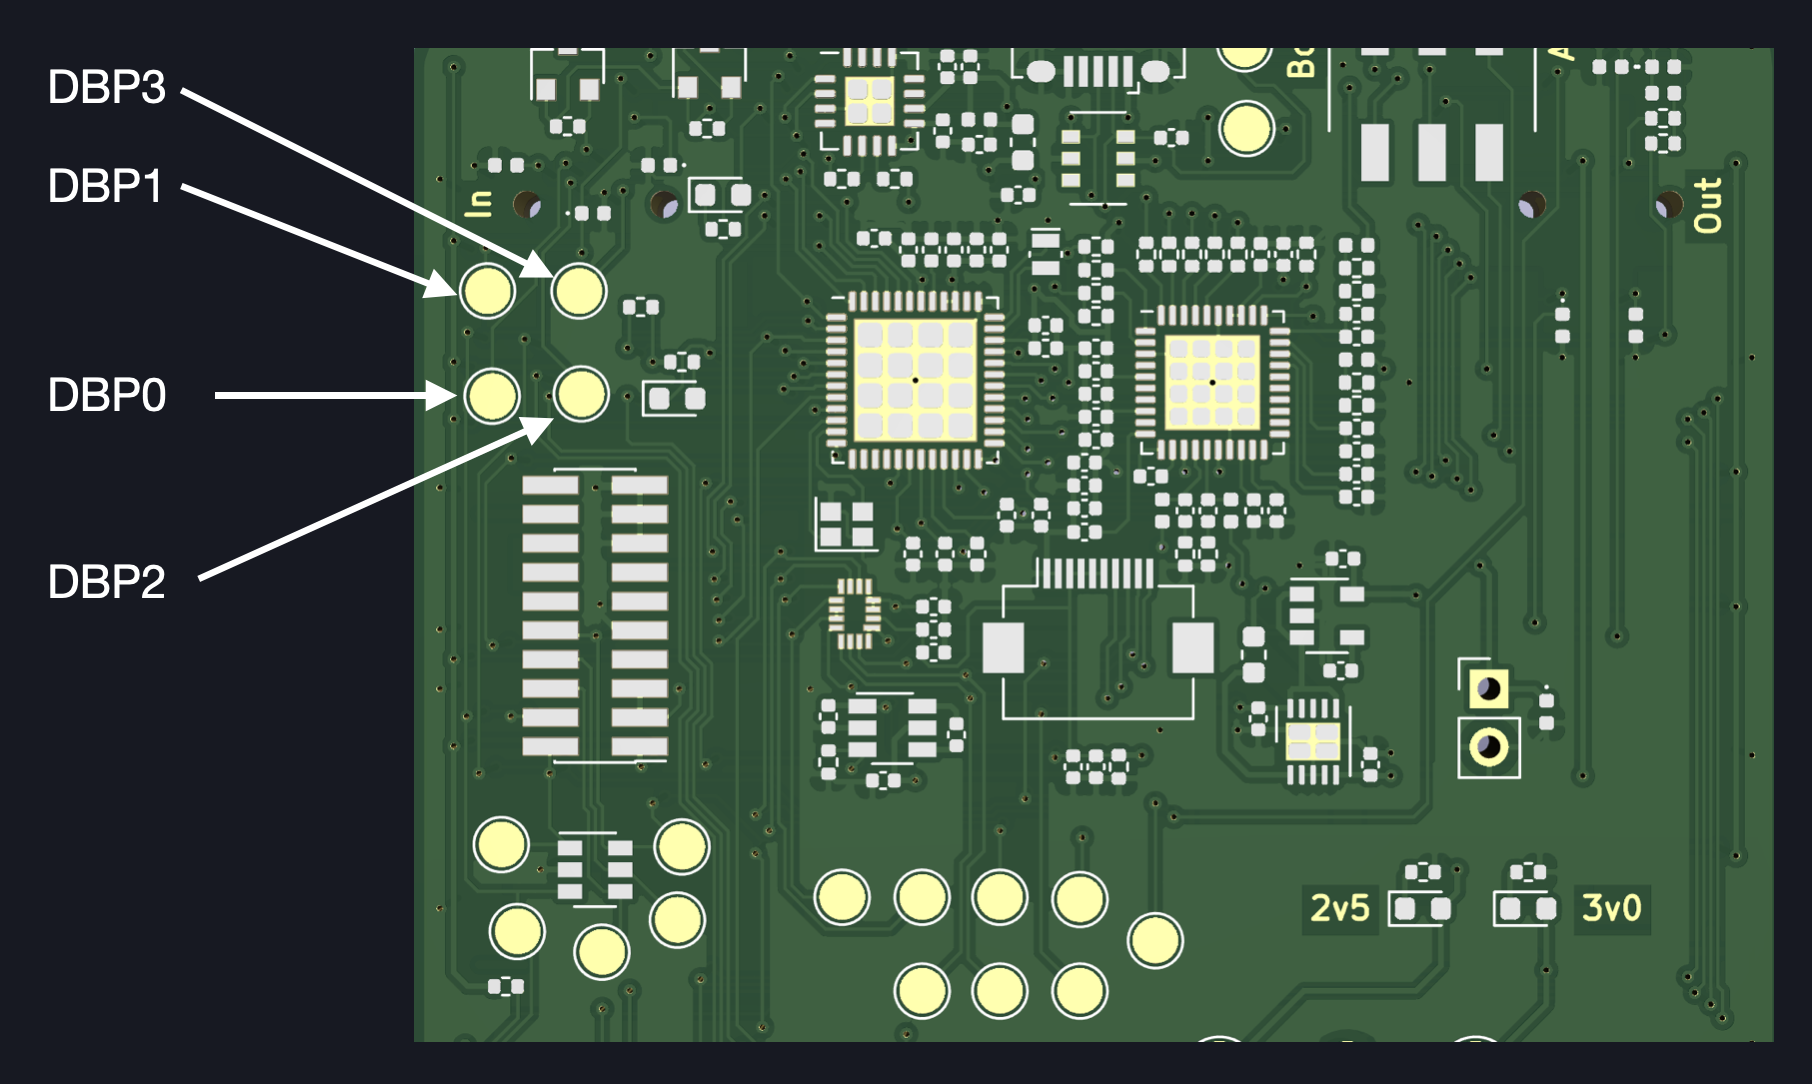
The test points can be toggled high or low using BM_DebugServices_set, BM_DebugServices_clear or BM_DebugServices_toggle and measured with a logic analyzer, multimeter or oscilloscope:
//  Example Use Case
//  DBP0 is set high and then low after function_to_be_time() finishes.
//  The pulse width can be measured with an oscilloscope or logic analyzer to determine the execution time
BM_DebugServices_set(DBP0);

function_to_be_timed();

BM_DebugServices_clear(DBP0);
Timers
The debug module also features timers that may be used to profile performance. The timers use the WTIMER peripheral and can be accessed through the functions BM_DebugServices_startPerformanceTimer and BM_DebugServices_getTimeElapsed. Note that the latter returns the time elapsed in microseconds:
//  Example Use Case
BM_DebugServices_startPerformanceTimer(1);

function_to_be_timed();

int32_t time_in_usec = 0;
BM_DebugServices_getTimeElapsed(&time_in_usec);
BM_DebugServices_startPerformanceTimer(0);  //  Stop timer
LED Indicator
A red LED indicator can also be controlled through the functions BM_DebugServices_setAlertLED and BM_DebugServices_clearAlertLED.
The debug ports, timers and LEDs available are subject to change with later PCB revisions.